 Linux Networking |
| Linux Networking |
We begin this process with the protocol analyzer output from our previous example, however, in this example, we have expanded out the middle display to see packet details:

In this example, the ARP packet (highlighted in the top window) is displayed in increased detail in the second window. This analysis shows that the destination MAC address of the Ethernet packet if 'ff:ff:ff:ff:ff:ff:' which indicates that it is a broadcast Ethernet packet, received by all Ethernet cards on the local area network. The highlighted protocol element from the middle window is also shown in the byte-for-byte packet contents in the bottom window of the analyzer.
Protocol analyzers such as this are very handy for understanding the details of what is happening in a sequence of packets. For example, the next depiction uses the TCP stream following software built into this analyzer to see the exchange between the web browser and web server:

This was done by selecting the first TCP packet in the stream, right clicking on the mouse button, and selecting Follow TCP Stream. Note that the outbound traffic is indicated in red and the inbound traffic is indicated in blue. This analysis ignores the packet header information and presents only the content exchanged between parties.
There are some very important things to note about this. One thing is that if the exchange is not encrypted and contains user IDs or passwords, a sniffer like this can readily capture and display those IDs and passwords as well as the detailed content of the exchange that took place. This also means that in order to verify that this is not happening when you are using an encrypted protocol, a sniffer like this could be very handy.
A lot of other information is revealed in this process as well. For example, the browser being used in this session is Mozilla/5.0 running under X11 on Linux on an i586 class computer, in English, rev 0.9.9. The computer is rigged to accept a variety of formats (shown in the listing). On the server side, all.net is hosted by an Apache/1.3.26 server for Unix and has FrontPage and PHP enabled. The time of the transaction is also included. This information can be very handy in debugging a faulty connection or identifying and eliminating network incompatibilities.
Also note that the sender requested the content by entering:
get /index.html HTTP/1.0
We can do the same thing manually with a telnet session using port 80 as the destination rather than the normal telnet port:
wg:root /root> telnet all.net 80
get /index.html HTTP/1.0
[ENTER]
That is, we 'telnet' to port 80, enter the next line followed by pressing [ENTER] and then press [ENTER] again. The result should look like the one shown below... followed by the rest of the content of that web page. The 'telnet' program creates a TCP session between the computer it is run on and a remote computer on the port specified for the session, in this case port 80, the port used for most Hyper Text Transfer Protocol (HTTP) traffic associated with the world wide web.

This technique is commonly used to debug a connection because rather than depending on a browser to enter the desired content, we can more directly control that content. Another program that is even more cleanly designed to do this sort of debugging is called 'netcat' and run with the command 'nc'. To get help on 'netcat', type:
wg:root /root> nc -h
Many networking experts use netcat to do a wide range of tasks. For example, netcat can act as a simple 'proxy' that makes a connection between an incoming and an outgoing session. In the example below, nc is used to proxy attempts to connect to port 22 on the this computer to port 80 on a different computer. If someone tries to use secure shell (ssh) to come to this computer, they will get an incompatible protocol (http), but if they want to use the web, they can come to this computer on port 22 and get web access to all.net. You can think of it as a rewiring of protocols to different ports and IP addresses.
wg:root /root> nc -l -p 22 all.net 80
To test this out, use your web browser and go to your IP address on port 22. The result is a bit surprising...

The web browser refuses to go to port 22 because the designers wanted to protect against people reassigning port numbers and using the Internet as they wanted to regardless of the RFCs. But fear not. With 'nc' we can fix this as well. We just need to rewire a bit more...
wg:root /root> nc -l -p 80 -n 127.0.0.1 22
This rewiring will make it so access to port 80 on this computer will be redirected to port 22 on 127.0.0.1 (the loopback interface on this computer). Then the other 'nc' command will redirect it back to port 80 on all.net. This can go on and on through multiple computers and multiple networks so that the eventual destination is well obscured from the originating request. It can also be used to move TCP and UDP packets through gateways under control.
A different view of an operating network can be provided by using different sorts of tools. This example is a tool called 'EtherApe' that can be run by selecting EtherApe in the Sniffers entry in the Administrator X11 menu. Please run it on your computer now and see what you see:
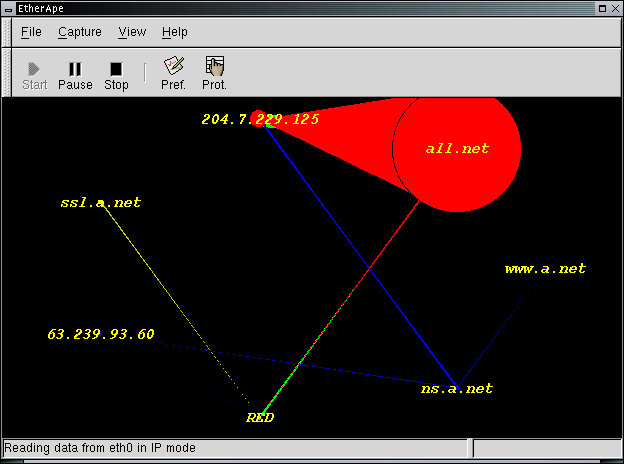
This protocol visualization tool provides color association with protocol elements (e.g., DNS is blue and HTTP is red in this picture), shows the links between IP addresses or host names and the traffic pattern, and uses size to indicate relative traffic quantities. Traffic patterns decay over time so that older traffic is not visible. In this example, 204.7.229.125 is downloading a lot of content from the all.net web site. just after having looked up an IP address from ns.a.net, an internal DNS. This was done by using the tool 'httrack' which can download an entire web site or set of web sites of desired. It is accessible by selecting Ghttrack from the Investigate/Audit X11 menu or from the command line by typing a command like:
wg:root /root> track http://all.net/index.html zz
This particular command downloads all files starting with 'http://all.net/index.html' into a directory called 'zz' which it creates for the purpose. Note that all.net has a lot of content, so you might want to stop this process before it goes too far... Use [CTRL-C] to stop it after a minute or two.
Another way to look at traffic is via statistical analysis. The 'ntop' program does this quite will for the statistics it provides, and you can add your own plug-ins if so desired to get the exact information you want. It is accessible by selecting ntop from the Sniffers entry in the Administrators X11 menu. In this particular output, ntop provides usage patterns by protocol:
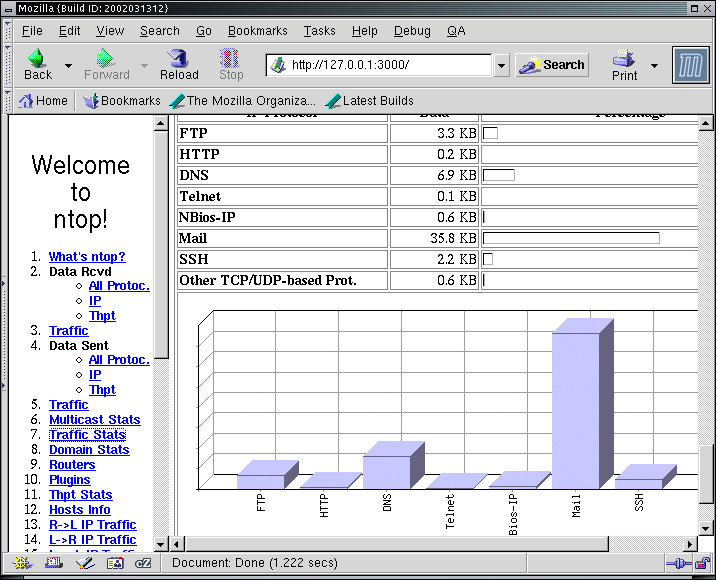
The File Transfer Protocol (ftp), HTTP, DNS, Telnet, Windows (BIOS-IP), Mail, and SSH traffic all appeared on this network during the statistics gathering process in the proportions shown. Other reports include such things as identification of gateway computers and MAC addresses, association between browsers and servers, inbound and outbound traffic patterns, and the list goes on and on. Run ntop on your computer for a few minutes and try out the different menu selections to get a sense of what ntop can do for you. Try also browsing the web and performing other related tasks along the way.
Scanners are programs that 'scan' address ranges to identify services that are available. This differs from the sniffers and other tools above which do not send out datagrams but passively observe and analyze traffic. In their simplest form, scanners send out packets of different sorts and observe the responses. In more complex cases they perform detailed analysis against known vulnerabilities and adapt what they send to the returns they receive and other observations they glean passively.
One of the best known scanners is 'nmap' - a network mapping tool. Nmap is often used to verify that systems are configured as they should be, but it can also be used by attackers to try to identify potentially vulnerable services by examining which ports are available for exchanges of information. Nmap also has capabilities for identifying the types of systems it is communicating with based on known features of datagrams produced by specific operating systems. For example, Windows might use a higher TTL field in IP packets than Linux, or they might respond with different ICMP responses to different fields in packets. Nmap is run by selecting Nmapfe (Nmap Front End) from the Investigate/Audit X11 menu:

In this example, a scan was done of IP addresses 204.7.229.12 through 204.7.229.17. The various parameters of the scan are indicated by the check boxes. This front end to nmap (called nmapfe) also shows the Nmap command that would be used to invoke the same results from a non graphical interface. In this case, it found a computer that appeared to be running Windows NT version 4, Windows 98, or Windows 95. This computer was only running netbios - the Windows universal network interface. The previous scanned box appears to have a number of services running, including pop-3 (email retrieval), sunrpc (remote procedure call), netbios (like the windows box - probably a Samba server under Linux), a printer daemon, a pop3 secure mode server, and the X11 interface. If you are operating a network under reasonable controls, computers like these are commonplace, and it is important to track what services should be running on which computers in order to assure that they are operating properly and to diagnose problems.
While nmap is a very useful network administration tool, Nessus is a much more complex vulnerability scanner, designed to identify specific vulnerabilities on specific hosts. Nessus takes some time to start up because internal programs have to be configured before it will operate, even though the user interface is operating. The password is 'root' as is the user ID in this installation, and you need to enter this before operation will proceed. Nessus is run by selecting Nessus from the Investigate/Audit X11 menu:
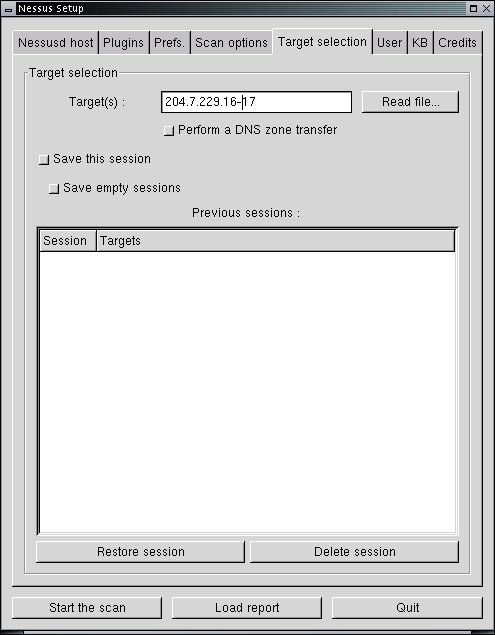
The password is 'root' as is the user ID in this installation, and you need to enter this before operation will proceed. After that, you can select to specify the 'Target' of your scans and other parameters of interest. Nessus takes some time to do its work and it tests for thousands of known vulnerabilities along the way. The reports it gives are adequate to explain what it has identified, the potential risks associated with it, and where to get information to repair any problems it has identified. During scanning the process looks something like this:
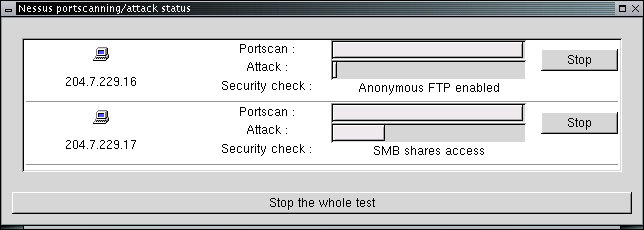
In this case, the two computers being scanned for vulnerabilities are progressing at different rates because they have different services enabled. The entire scan takes about 5-10 minutes on a typical network and the end result in this case is shown here:
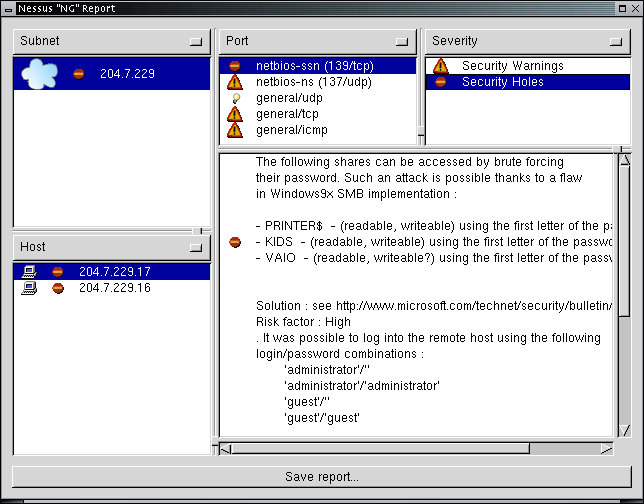
In this case, computer 204.7.229.17 has a set of warnings and one 'hole'. The hole is identified and the location to review for a fix is provided. As a network administrator who is interested in providing a reasonable degree of protection for the computers on the network, this kind of report can be very helpful, however, there is also utility for attackers in such tools because it helps them identify vulnerabilities automatically and leads them to what they need to find an online copy of the exploit. In this case, the benefits to the network administrator seem to out weight those to the attacker.
Npulse is another very handy administrative tool provided on the White Glove CD. This tool periodically checks the status of computers on a network and identifies changes in the network for the administrator by doing repeated scans of the network. For example, when someone adds or removes a computer from the network, npulse will find that new computer and report on what it is and what services it offers. Similarly, Npulse tracks computers being turned on and off. When debugging network components, npulse can act as a nice tool for keeping track of the activities underway. It is also useful for monitoring contractors on your network if you have provided them with specific accesses and for detecting when the network is going down or critical computers are failing before users complain. Npulse can be run by selecting Npulse from the Investigate/Audit X11 menu:

When npulse starts up it requests a user ID and password. These are both preset to 'admin'. Once this happens, select Setup and request the IP addresses to be scanned by filling in the 'Discover' area with a specification like '204.7.229.10-20' and press the 'go' button. Then press the go icon next to "Default List" and press the On/OffHome button and select one of the different 'views' such as the one above or below.
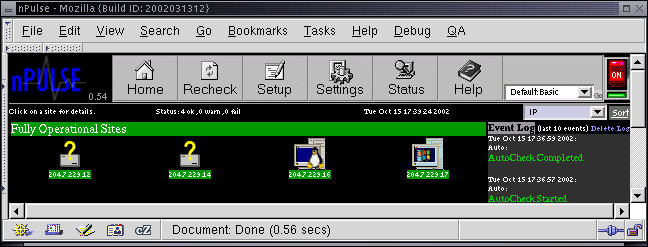
From the previous views, if you press on an IP address or icon for a computer, you get a more detailed report such as the one displayed here:

Npulse will continue its attempts to seek out new computers and report on changes in old ones as long as it runs.
We have described how protocol analyzers can be used to get detailed information on packets as they pass through the network and demonstrated how they can be used for benefits as well as how they introduce risks. We have shown how telnet and netcat can be used to help debug network connections and to act as a switchboard for redirection of network traffic. We have shown several different systems for viewing network traffic in different ways and discussed how scanners can be used to examine, test, and observe network status and conditions.